

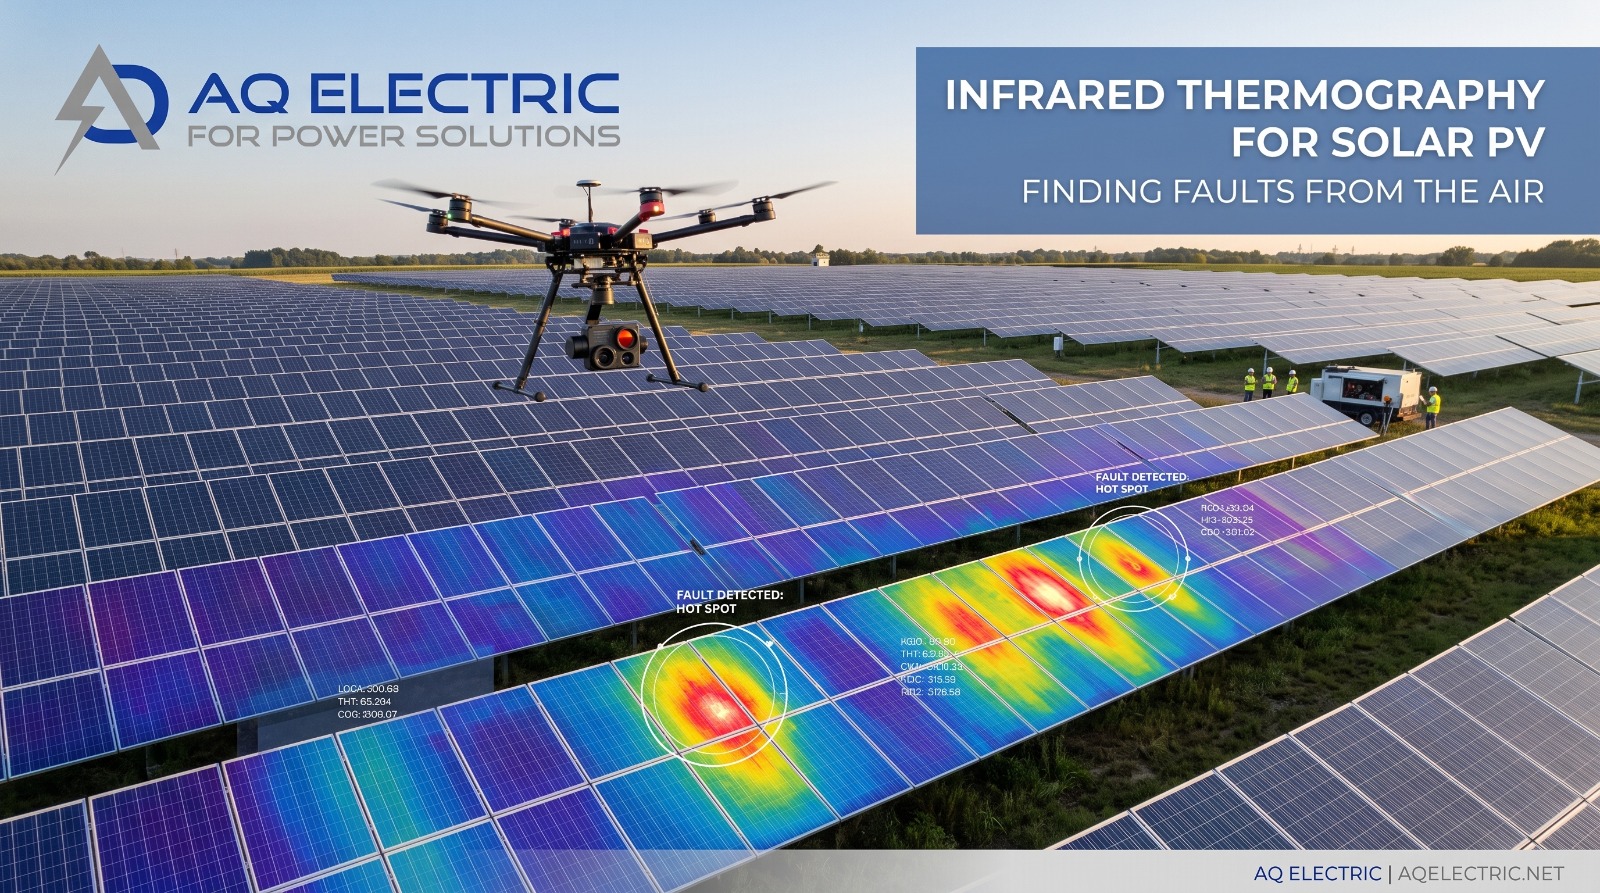
AQ Electric uses infrared thermography on solar PV plants across the MENA region because it is the fastest, most scalable way to find faults that would otherwise stay hidden until they cost real money. On utility-scale projects — including thermal drone inspection delivered for ACWA Power and NOMAC on plants in Aswan, Egypt — AQ Electric’s infrared thermography has located hotspots, failed modules, and connection faults across hundreds of thousands of panels in a fraction of the time ground inspection would take. When a solar plant spans millions of modules in the desert heat, infrared thermography for solar PV is not a luxury; it is the only practical way to keep the plant healthy.
This article explains infrared thermography for solar PV from the ground up: what the technique is and the physics behind it, how aerial drone thermography works, the international standard (IEC TS 62446-3) that governs it, the anomaly categories it classifies, how it compares with IV curve tracing and electroluminescence testing, and why it has become essential across commissioning and ongoing operation and maintenance. Whether you are an EPC closing out a project, an O&M manager protecting yield, or an asset owner assessing plant health, this is the practical reference on the most efficient diagnostic in large-scale solar — and how AQ Electric’s drone-based inspection puts it to work.
What Is Infrared Thermography for Solar PV?
Infrared thermography for solar PV is a non-contact diagnostic technique that detects faults in photovoltaic modules and systems by measuring the heat they emit. Every object radiates infrared energy in proportion to its temperature, and an infrared (thermal) camera converts that invisible radiation into a visible image in which temperature differences appear as colour or brightness variations. In a solar plant, a healthy module operates at a predictable, uniform temperature — but a fault almost always produces abnormal heat. Infrared thermography makes that abnormal heat visible, instantly revealing where a problem lies.
The power of infrared thermography for solar PV is its combination of speed and coverage. A technician with a multimeter can test one string at a time; a thermal camera captures the condition of hundreds of modules in a single frame. Mounted on a drone, infrared thermography can survey an entire utility-scale plant in a day or two — scanning for hotspots, failed modules, bypass-diode faults, connection issues, and severe soiling without taking the plant offline. For the gigawatt-scale plants now common across the MENA region, this efficiency is precisely why infrared thermography has become a cornerstone of modern solar diagnostics and a core service in AQ Electric’s inspection offering.
The Physics: Why Faults Run Hot
Infrared thermography for solar PV works because electrical faults convert energy into heat. When a solar cell or module is functioning normally, nearly all the energy it receives is converted into electricity and flows out through the circuit. But when something goes wrong — a crack isolates part of a cell, a bypass diode fails, a connection corrodes, or shading forces a cell into reverse bias — the affected area can no longer pass current efficiently. Instead, it dissipates that energy as heat, running hotter than its healthy neighbours.
This temperature difference, known as Delta-T, is the signal infrared thermography reads. The magnitude of Delta-T often indicates the severity of the fault: a small temperature rise of a few degrees may indicate a minor performance issue, while a difference exceeding 20–30 °C often signals a critical failure that poses a fire risk or significant revenue loss. By measuring Delta-T precisely — which requires a radiometric thermal camera that records the actual temperature of every pixel, not just relative differences — infrared thermography for solar PV can both locate a fault and estimate how serious it is. This is the difference between a camera that produces a pretty picture and one that produces an engineering diagnosis.
Radiometric vs non-radiometric
Serious infrared thermography for solar PV requires a radiometric camera, which captures the specific temperature value of every pixel. Non-radiometric cameras show only relative temperature differences — enough to spot that something is hot, but not enough to quantify severity or classify the fault to standard. AQ Electric uses radiometric thermal imaging for exactly this reason.
Aerial Drone Thermography
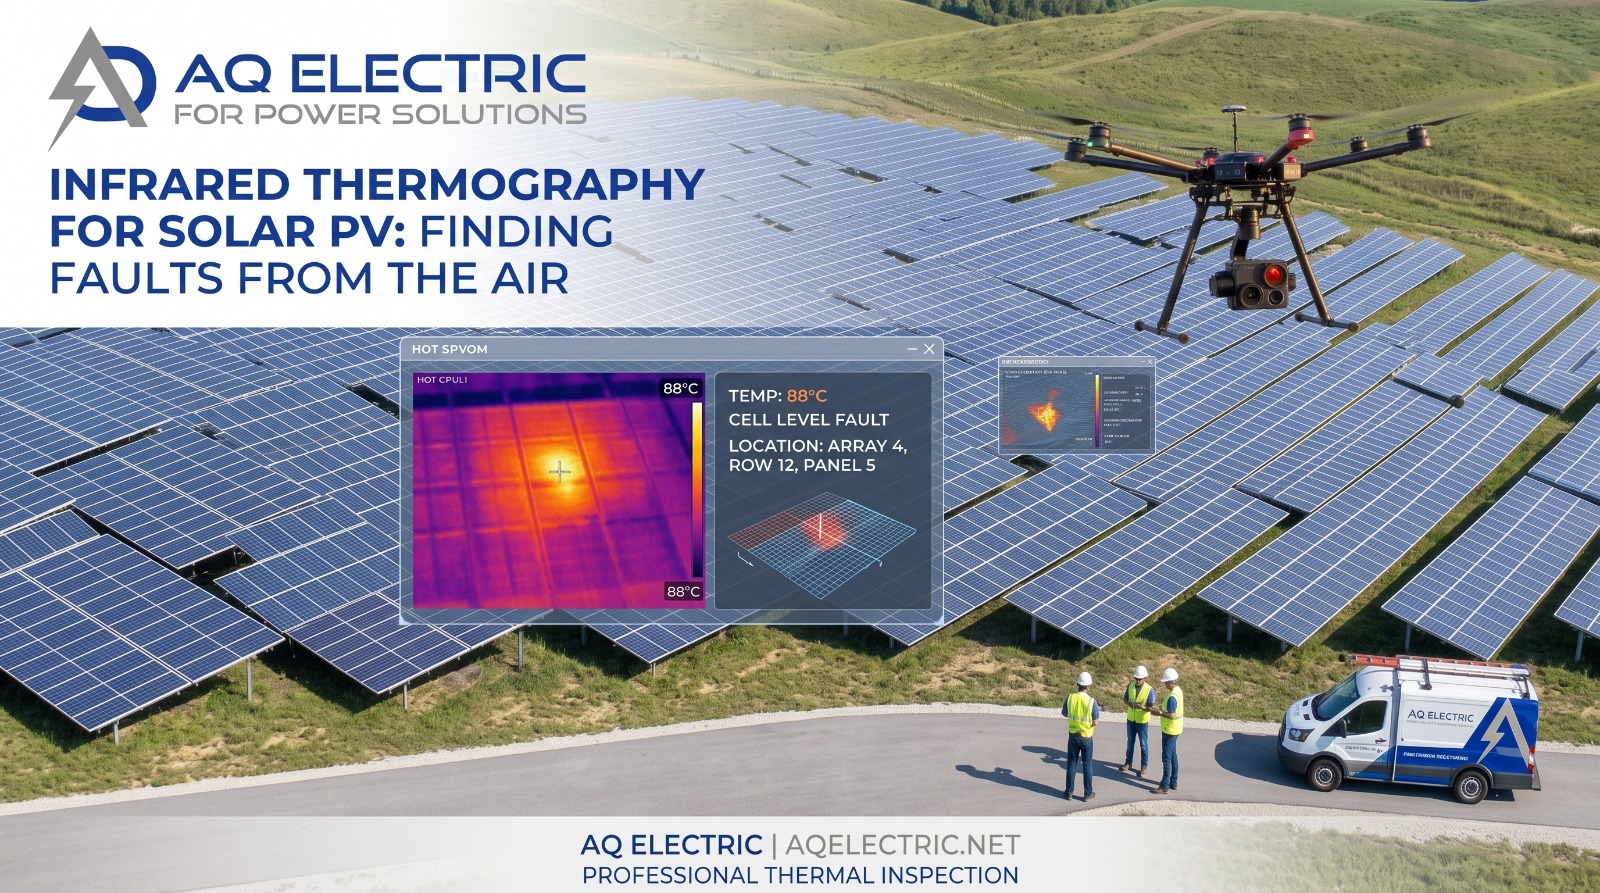
While infrared thermography can be performed with handheld cameras at ground level, the technique that has transformed utility-scale solar inspection is aerial drone thermography. By mounting a radiometric thermal camera (usually alongside a high-resolution RGB camera) on an unmanned aerial vehicle, an entire plant can be surveyed from above quickly, safely, and comprehensively.
The advantages of drone-based infrared thermography for solar PV are decisive at scale:
- Speed — a drone can inspect a 100 MW plant in one to two days, where ground inspection would take weeks.
- 100% coverage — every module is imaged, not a sample, so no fault is missed.
- Safety — no technicians walking live DC arrays in extreme heat for extended periods.
- No downtime — the plant keeps operating under load during inspection, which is in fact required for thermography to work.
- Georeferenced mapping — thermal and RGB images are stitched into orthophoto maps that pinpoint the exact location of every anomaly for the repair team.
The output of a professional drone thermography campaign is not a folder of images but a structured deliverable: an anomaly register classifying every fault by severity, defect maps showing exact locations, and a repair prioritisation that tells the O&M team what to fix first. This is what AQ Electric delivers — infrared thermography for solar PV as actionable engineering intelligence, not raw data.
IEC 62446-3: The Governing Standard
Credible infrared thermography for solar PV is governed by a dedicated international standard: IEC TS 62446-3 — the technical specification for outdoor infrared thermography of photovoltaic modules and plants. This standard defines the conditions, method, and reporting required for a thermographic survey to be authoritative, and it is the benchmark that lenders and insurers recognise.
IEC TS 62446-3 governs the critical parameters that determine whether a thermography survey produces reliable results:
- Minimum irradiance — the standard requires solar irradiance above a defined threshold (typically 600 W/m²) so that modules are generating enough power for faults to produce a detectable thermal signature.
- Viewing angle and geometry — specific camera angles relative to the modules to avoid reflections and ensure accurate temperature measurement.
- Camera resolution and sensitivity — minimum thermal resolution and sensitivity (NETD) so that small anomalies are detectable.
- Operator competence — the standard is explicit that training on the camera provided by its manufacturer is not sufficient; proper thermographic analysis requires qualified PV thermographers.
- Reporting format — a conformant report with classified anomalies, not just thermal images.
Crucially, drone thermography is not IEC 62446-3 compliant by default — compliance has to be designed into the campaign through the right conditions, equipment, geometry, and analysis, and stated in the report rather than assumed. This sits within the broader IEC 62446 family: Part 1 covers electrical commissioning testing, Part 3 covers outdoor thermography. For the full framework, see AQ Electric’s IEC 62446-1 article.
AQ Electric delivers IEC 62446-3 drone thermography across MENA — call +962 79 51 54 126.
The Anomaly Categories
A key output of standards-based infrared thermography for solar PV is the classification of each thermal anomaly into a defined category. IEC TS 62446-3 provides the framework, and thermal anomalies are commonly divided into categories based on the pattern of heat they produce:
| Class | Pattern | Likely cause |
|---|---|---|
| A | Single hotspot in a module | A single cell or part of a cell overheating — crack, defect, or localised shading |
| B | Multiple hotspots in a module | Several cell-level defects or soiling patterns |
| C | Uniformly hot substring | A bypass diode activated or a substring short circuit |
| D | Uniformly hot module | A disconnected or faulted module carrying no current |
| E | Uniformly hot string | A series of disconnected modules — a string-level fault |
Each class points to a different root cause and a different remedy. A single hotspot (Class A) might call for module replacement; a uniformly hot string (Class E) points to a connection or wiring fault that may be fixable without touching the modules. This is why interpretation matters so much: the same thermal image is near-useless as raw data but highly valuable when a qualified thermographer classifies every anomaly and maps it to an action. AQ Electric’s infrared thermography reports deliver exactly this classification.
Getting the Conditions Right
The accuracy of infrared thermography for solar PV depends heavily on performing the survey under the right conditions — a point that separates professional thermography from casual drone flights.
Sufficient Irradiance
Modules must be generating enough power for faults to heat up detectably, which is why IEC 62446-3 requires irradiance above roughly 600 W/m². Surveys flown under cloud or at low sun angles produce unreliable results.
Clear Sky and Stable Weather
Passing clouds change module temperature rapidly and create false readings. Thermography requires stable, clear conditions throughout the survey.
Time of Day
Mid-morning to mid-afternoon on a clear day typically provides the stable high irradiance needed. In the MENA region, this must be balanced against extreme midday heat and its effect on equipment and crew.
Low Wind
High wind cools modules unevenly and makes drone flight less stable, degrading image quality. Calm conditions produce the cleanest data.
Thermography vs IV Curve Tracing vs EL Testing
Infrared thermography is one of three complementary diagnostics, and the strongest testing programmes use all three in concert. Understanding how they differ clarifies when each is used.
| Technique | What it finds | Key strength |
|---|---|---|
| Infrared thermography | Hotspots, failed modules/strings, connection faults | Speed and 100% coverage at scale |
| IV curve tracing | Electrical underperformance, mismatch, resistance | Quantifying string electrical health |
| EL testing | Microcracks, cell defects, PID | Internal module defects invisible to others |
The three work best together. Infrared thermography rapidly scans the whole plant and flags where the problems are; IV curve tracing then quantifies the electrical impact on the affected strings; and electroluminescence testing confirms the exact module-level cause. A fault that thermography sees as a hotspot, EL testing may reveal as a specific microcrack pattern. Because AQ Electric delivers all three in-house, we can deploy them intelligently — using thermography to find, and the others to diagnose — rather than treating each as an isolated service.
When Infrared Thermography Matters Most
Infrared thermography for solar PV delivers value at several points in a plant’s life:
At Commissioning
A thermographic survey at commissioning catches manufacturing and installation faults — hot connections, defective modules — before handover, while responsibility can still be assigned. It is a Category 2 requirement under IEC 62446 for utility-scale plants.
Periodic O&M Inspection
Regular thermographic inspection during operation — typically annually, or more often in dusty climates — catches faults that develop over time, from failed bypass diodes to connection degradation, before they cause significant yield loss.
After Extreme Weather
Following storms, hail, or extreme heat events, infrared thermography rapidly assesses whether modules and connections have been damaged — essential for insurance claims and safety.
Troubleshooting Underperformance
When monitoring data shows a plant underperforming but cannot say why, infrared thermography is the fastest way to locate the physical source of the loss across the whole array.
Infrared Thermography in MENA Conditions
Performing infrared thermography for solar PV in the MENA region introduces specific considerations that AQ Electric’s field experience across Jordan, Egypt, and Saudi Arabia has refined into standard practice.
Extreme Ambient Heat
The MENA region’s extreme heat raises the baseline temperature of every module, which can compress the apparent Delta-T between healthy and faulty modules and make interpretation harder. Experienced thermographers account for high ambient temperatures when classifying anomalies — a nuance that inexperienced operators miss.
Heavy Soiling Signatures
Dust and soiling produce their own thermal patterns that must be distinguished from genuine module faults. In the MENA region, where soiling is severe, a thermographer must know the difference between a soiling-induced warm patch and a real cell defect — otherwise the report is full of false positives.
Scheduling Around Heat and Dust
Surveys must be timed for the stable high-irradiance windows the standard requires, while managing the extreme midday heat that stresses both drones and crews. Dust storms also impose scheduling constraints. Regional experience makes this routine.
Scale of Gulf Plants
The sheer size of Gulf utility plants — running to gigawatts — makes drone thermography not just preferable but essential; no other method can cover these areas within a practical timeframe. AQ Electric’s drone capability is built for exactly this scale.
AQ Electric’s Infrared Thermography Services
AQ Electric for Power Solutions, founded in Jordan in 2019 and expanded to Egypt in 2021, provides specialist infrared thermography for solar PV across the MENA region as part of its complete testing and diagnostics offering. With over 1.0 GW of PV project experience and an ISO 9001, ISO 14001, and ISO 45001-certified management system, AQ Electric delivers drone-based infrared thermography to IEC TS 62446-3 standard, with radiometric thermal imaging and qualified thermographic analysis.
Our thermography experience includes utility-scale thermal drone inspection delivered for ACWA Power and NOMAC on major plants in Aswan, Egypt — exactly the kind of large, hot, dusty environment where professional infrared thermography proves its value. Because AQ Electric delivers thermography alongside IV curve tracing, electroluminescence testing, and full commissioning in-house, we combine techniques intelligently: thermography finds the anomalies fast, and our other diagnostics confirm the root cause — a complete picture from a single partner.
Our infrared thermography services include IEC 62446-3-conformant survey planning, radiometric drone and handheld imaging under correct conditions, anomaly classification by severity class, georeferenced defect mapping, and a repair-prioritisation report that tells your O&M team exactly what to fix first. Whether you need commissioning-stage thermography, periodic O&M inspection, or post-event damage assessment, AQ Electric’s team has the equipment, the standards, and the regional expertise to deliver it. For the broader maintenance context, see our solar operation and maintenance services, or contact our engineers to scope a survey.
AQ Electric Solar Testing & Diagnostics
The full diagnostic scope, delivered in-house across the MENA region.
🚁Drone Inspection📊IV Curve Tracing🔬EL Testing⚡Testing & Commissioning🔧Operation & Maintenance🔍Third-Party Inspection✓Quality Assurance (FAT & SAT)✉Speak to an Engineer
Frequently Asked Questions
What is infrared thermography for solar PV?
Infrared thermography is a non-contact technique that detects faults in solar modules by measuring the heat they emit. Faults dissipate energy as heat, running hotter than healthy modules, and a thermal camera makes this visible — instantly revealing hotspots, failed modules, bypass-diode faults, and connection issues.
Why is drone thermography used for solar plants?
Drone-based infrared thermography can survey an entire utility-scale plant in one to two days with 100% module coverage, no downtime, and no technicians walking live arrays in extreme heat. For gigawatt-scale plants, it is the only practical way to inspect every module.
What standard governs solar thermography?
IEC TS 62446-3 is the technical specification for outdoor infrared thermography of PV modules and plants. It defines the irradiance threshold (typically 600 W/m²), viewing geometry, camera requirements, operator competence, and reporting. Drone thermography is not compliant by default — compliance must be designed into the campaign.
What conditions are needed for accurate thermography?
Solar irradiance above roughly 600 W/m², clear and stable skies, low wind, and the right time of day. Surveys flown under cloud, at low sun angles, or in high wind produce unreliable results. A radiometric camera is also essential to measure actual temperatures.
How does thermography differ from IV curve tracing and EL testing?
Thermography rapidly scans the whole plant and flags where faults are. IV curve tracing quantifies the electrical impact on affected strings. EL testing reveals internal module defects like microcracks. The strongest programmes use all three together — thermography to find, the others to diagnose.
How often should a solar plant have a thermographic survey?
A thermographic survey at commissioning plus annual inspection during operation is typical, with more frequent surveys in dusty climates or after extreme weather. In the MENA region, annual or semi-annual drone thermography is common practice.
Does AQ Electric provide drone thermography across the MENA region?
Yes. AQ Electric provides IEC 62446-3 infrared thermography via its drone inspection services across Jordan, Egypt, Saudi Arabia, and the wider MENA region, with radiometric imaging and qualified analysis, and over 1.0 GW of project experience.
Find Every Fault, Across Your Whole Plant
Infrared thermography is the fastest way to locate faults across a solar plant — and AQ Electric delivers it to IEC 62446-3 standard with radiometric drones and qualified thermographers. Over 1.0 GW of project experience, ISO-certified, and proven on utility-scale plants for ACWA Power, NOMAC, SEPCO, CEEC, and Power China.
PV projects supported
MENA countries covered
ISO certifications9001 · 14001 · 45001
Founded in Jordan