

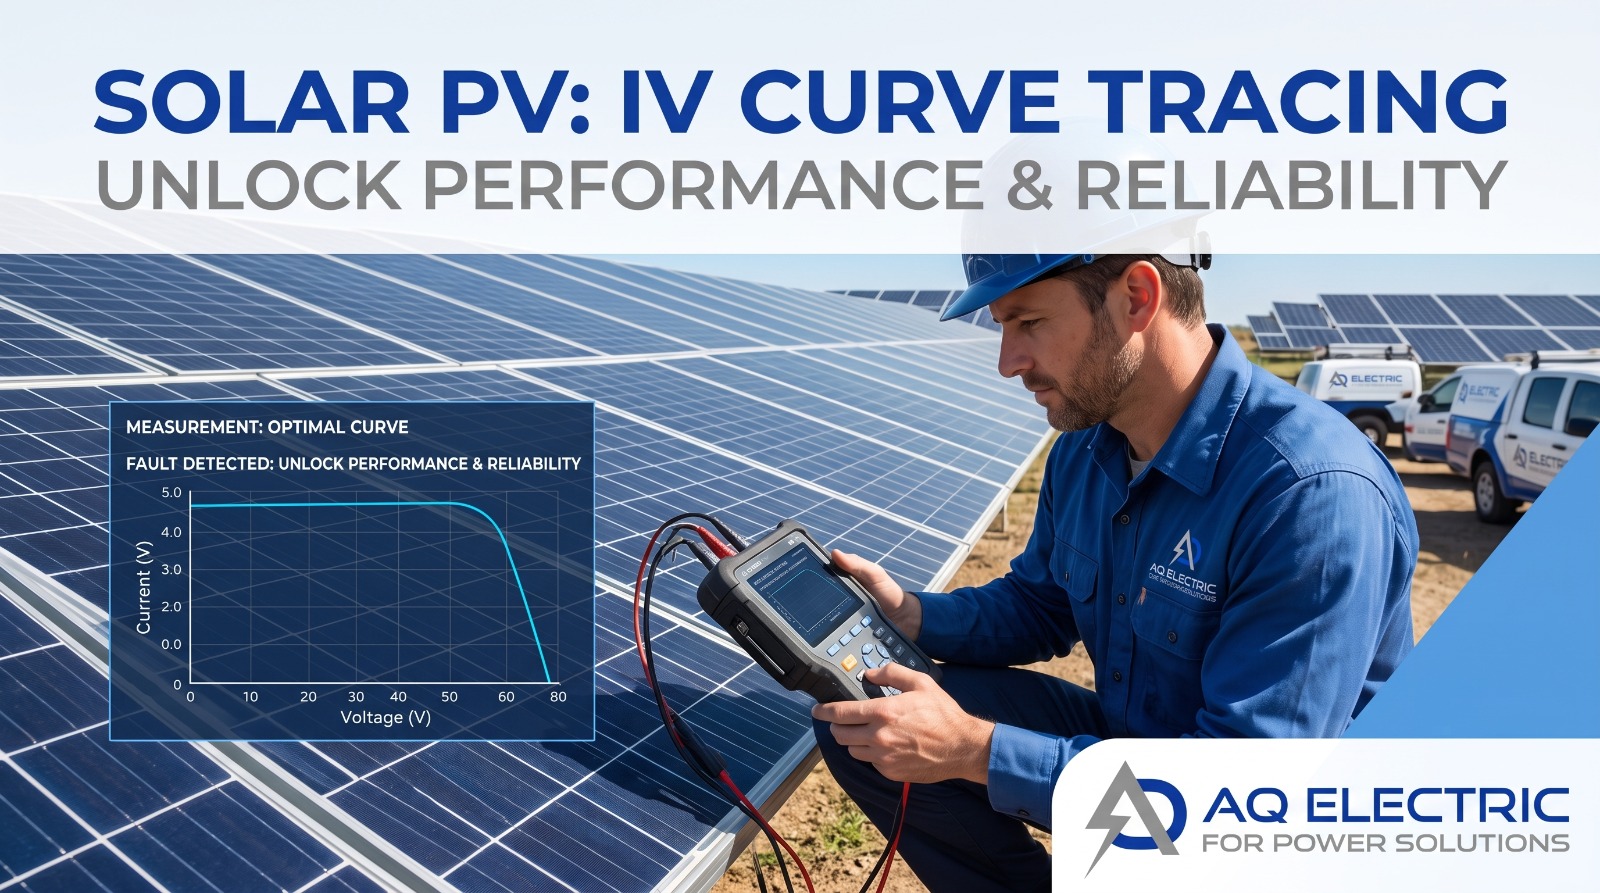
AQ Electric uses IV curve tracing on solar PV projects across the MENA region because it is, quite simply, the most powerful diagnostic tool available for understanding what a solar array is actually doing. From the Fountain Mall installation in Aqaba to utility-scale plants across Egypt and Saudi Arabia, IV curve tracing has allowed our engineering team to see past the surface numbers and identify the exact faults costing owners their yield. If a solar plant is underperforming and no one can say why, IV curve tracing is almost always how the answer is found.
This guide explains IV curve tracing for solar PV from the ground up: what an IV curve is, what the shape of the curve reveals, how the test is performed in the field, what specific faults it diagnoses, how it fits within the IEC 62446-1 testing framework, and why it has become an indispensable part of both commissioning and ongoing operation and maintenance. Whether you are an EPC contractor closing out a project, an IPP investigating underperformance, or an O&M manager building a testing programme, this is the practical reference on the single most revealing test in solar PV diagnostics — and how AQ Electric’s IV curve tracing services put it to work.
What Is an IV Curve?
An IV curve — short for current-voltage curve — is a graph that describes the complete electrical behaviour of a solar PV module or string. It plots the current (I) the device produces against the voltage (V) across its terminals, across the full range from short circuit to open circuit. Every solar module has a characteristic IV curve defined by its design, and comparing a measured IV curve against the expected one is the foundation of IV curve tracing as a diagnostic technique.
The reason the IV curve is so valuable is that it contains far more information than a simple power or voltage reading. A monitoring system might tell you a string is producing less power than expected, but it cannot tell you why. The shape of the IV curve, by contrast, encodes the specific physical cause — whether the loss is due to shading, soiling, module mismatch, degradation, a bypass diode failure, or resistance in the wiring. Learning to read that shape is what makes IV curve tracing so powerful, and it is a core skill of AQ Electric’s field engineers.
The Key Points on the Curve
Every IV curve has three defining points that any IV curve tracing analysis begins with:
- Short-Circuit Current (ISC) — the current when voltage is zero (terminals shorted). It is proportional to irradiance and to the module’s area, and it sits at the top-left of the curve.
- Open-Circuit Voltage (VOC) — the voltage when current is zero (terminals open). It depends on temperature and the number of cells in series, and it sits at the bottom-right of the curve.
- Maximum Power Point (PMAX) — the point on the curve where the product of current and voltage is greatest. This is where the inverter’s MPPT tries to operate the array, and it is defined by its own current (IMP) and voltage (VMP).
A fourth critical concept derived from these is the Fill Factor (FF) — a measure of how “square” the curve is, calculated as the ratio of maximum power to the theoretical maximum (ISC × VOC). A high fill factor indicates a healthy module; a low fill factor is one of the clearest signals in IV curve tracing that something is wrong. Resistance problems, in particular, show up immediately as a degraded fill factor.
What Is IV Curve Tracing?
IV curve tracing is the field measurement technique that captures the complete IV curve of a live solar string under real operating conditions, then compares it against the expected curve calculated from the module datasheet and the prevailing irradiance and temperature. The comparison reveals whether the string is performing as designed, and if not, the nature of the deviation points directly to the cause.
Unlike a simple voltage or current spot-check — which only confirms a value at one operating point — IV curve tracing captures the entire electrical signature of the string across its full operating range. This is why IV curve tracing is described as the definitive DC-side diagnostic: it does not just tell you a string is underperforming, it tells you why, and it does so non-destructively in a few minutes per string. AQ Electric’s IV curve tracing services apply this technique systematically across every string on a plant, producing a complete diagnostic picture of the DC array.
Why IV curve tracing beats monitoring data alone
A monitoring platform tells you a string produces less than its neighbours. IV curve tracing tells you whether that is shading, a bad connection, degraded modules, or a failed bypass diode — the difference between knowing there is a problem and knowing how to fix it.
How IV Curve Tracing Works in the Field
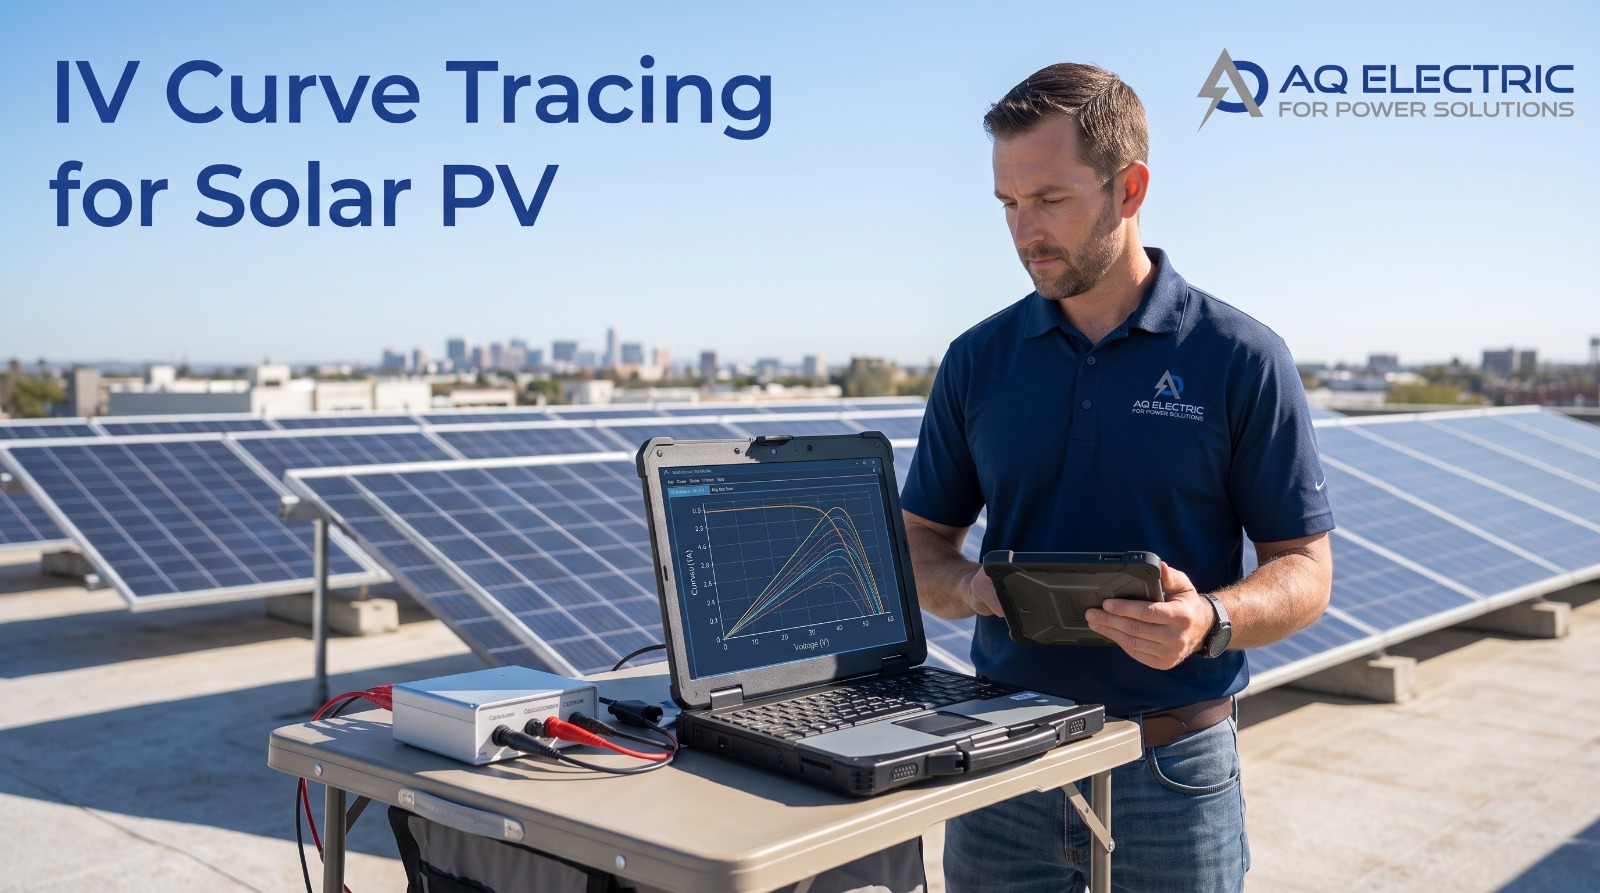
Performing IV curve tracing on a solar plant follows a disciplined procedure that AQ Electric’s engineers execute on every engagement. The process combines a specialist instrument — an IV curve tracer — with careful measurement of the environmental conditions that determine the expected values.
Step 1: Measure Environmental Conditions
Because irradiance and temperature directly determine the expected IV curve, IV curve tracing begins by measuring plane-of-array irradiance with a calibrated reference cell or pyranometer, and module temperature with a contact or infrared sensor. Without these, the measured curve cannot be meaningfully compared to expectation — a mistake that undermines a surprising amount of field testing.
Step 2: Connect the IV Curve Tracer
The IV curve tracer is connected to the string under test, typically at the combiner box or string end. The instrument rapidly sweeps the string’s operating point from short circuit to open circuit — capturing hundreds of current-voltage pairs in a fraction of a second — and records the complete curve.
Step 3: Normalise and Compare
The measured curve is normalised to Standard Test Conditions (STC) using the recorded irradiance and temperature, then overlaid against the expected curve derived from the module datasheet. Modern IV curve tracing software performs this comparison automatically and flags deviations.
Step 4: Interpret and Report
This is where expertise matters most. The shape and position of any deviation between measured and expected curves is interpreted to identify the specific fault mechanism, and the finding is documented in a report that feeds into the commissioning record or the O&M action list. AQ Electric’s IV curve tracing services close every engagement with a clear, actionable report — not just raw data.
AQ Electric delivers systematic IV curve tracing across MENA — call +962 79 51 54 126.
Reading the Curve: What Each Shape Means
The diagnostic power of IV curve tracing lies in interpretation. A healthy string produces a characteristic curve with a sharp knee and a high fill factor. Deviations from that shape each tell a specific story, and experienced IV curve tracing analysis reads them like a fingerprint.
Reduced Current (Curve Pushed Down)
When the whole curve sits lower than expected — reduced ISC — the cause is usually uniform soiling, a mismatch in module current rating, or a calibration/irradiance measurement issue. The shape stays similar but the current is suppressed.
Reduced Voltage (Curve Pushed Left)
When VOC is lower than expected, the likely causes are elevated temperature, fewer modules in the string than designed, or a short-circuited module or bypass diode conducting when it should not.
Steps or Notches in the Curve
A distinct step or notch in the IV curve is the classic signature of partial shading or a mismatched/failed module within the string. When part of the string is shaded or underperforming, its bypass diode activates, creating a characteristic step. IV curve tracing is uniquely able to reveal this — no other simple test shows it.
Rounded Knee (Low Fill Factor)
When the sharp knee of the curve becomes rounded and the fill factor drops, the cause is usually increased series resistance — corroded connections, undersized or degraded cabling, or poor terminations. This is one of the most commercially important findings because it points to fixable installation issues.
Sloped Plateau
When the flat top of the curve slopes instead of staying horizontal, reduced shunt (parallel) resistance is indicated — often a sign of cell-level defects, potential-induced degradation (PID), or module manufacturing issues.
Faults IV Curve Tracing Diagnoses
Because it reads the complete electrical signature of a string, IV curve tracing diagnoses a wide range of faults that would otherwise require guesswork or destructive investigation:
- Soiling and uniform contamination — suppressed current across the curve.
- Partial shading — characteristic steps from activated bypass diodes.
- Module mismatch — strings performing below their neighbours due to binning differences or batch variation.
- Series resistance faults — corroded connectors, undersized cable, poor terminations, revealed by a rounded knee.
- Shunt resistance faults — cell defects and PID, revealed by a sloped plateau.
- Bypass diode failures — steps and voltage reductions.
- Degradation over time — gradual reduction in fill factor and power across the fleet, tracked by comparing IV curve tracing results year on year.
- Wiring and configuration errors — wrong module count, cross-connected strings, revealed by voltage anomalies.
For faults on the DC string side specifically, IV curve tracing complements the string wiring verification covered in our solar string wiring guide — together they form a complete picture of DC-side health.
IV Curve Tracing and IEC 62446-1
IV curve tracing is formally embedded in the international standard for solar PV testing. Under IEC 62446-1, string I-V curve measurement is a Category 2 test — the enhanced testing level recommended for all commercial and utility-scale systems, above the basic Category 1 requirements that apply to every plant. For a complete walkthrough of the standard and its three testing categories, see AQ Electric’s complete IEC 62446-1 guide.
In practice, for any plant above roughly 1 MWp, IV curve tracing is now considered the market baseline rather than an optional extra — and bankable, lender-financed projects almost always require it. This is because the information IV curve tracing provides is exactly what lenders’ technical advisors and independent engineers need to confirm that a plant has been built to specification and will perform to its financial model. AQ Electric’s IV curve tracing services are delivered to full IEC 62446-1 Category 2 standard, with documentation structured for bankability.
IV Curve Tracing in Commissioning and O&M
IV curve tracing plays two distinct but connected roles across the life of a solar plant — and AQ Electric delivers both.
At Commissioning
During commissioning, IV curve tracing verifies that every string has been correctly installed and is performing to specification before the plant is handed over. It catches installation faults — poor terminations, mismatched strings, wiring errors — while they are still cheap and easy to fix, and it establishes the baseline against which all future measurements will be compared. This is part of AQ Electric’s testing and commissioning services.
During Operation and Maintenance
During the operational phase, periodic IV curve tracing tracks the health of the array over time, detecting gradual degradation, emerging faults, and underperforming strings before they cause significant yield loss. Comparing IV curve tracing results year on year reveals degradation trends that inform warranty claims and replacement decisions. This ongoing role is part of AQ Electric’s solar operation and maintenance services — and for the full O&M context, see our complete solar O&M guide.
IV curve tracing also works hand in hand with thermographic inspection: where IV curve tracing identifies an electrical anomaly in a string, drone thermographic inspection can pinpoint the exact module or connection responsible. Together, they are the backbone of modern predictive solar diagnostics.
IV Curve Tracing in MENA Conditions
Performing IV curve tracing in the MENA region introduces specific considerations that AQ Electric’s field experience across Jordan, Egypt, and Saudi Arabia has refined into standard practice.
High Irradiance and Temperature Correction
The intense irradiance and extreme module temperatures of the MENA region make accurate environmental measurement and temperature correction essential. A measured curve that is not correctly normalised for a 65 °C module temperature will appear to show a fault that is really just heat. AQ Electric’s IV curve tracing methodology is built around precise MENA-condition correction.
Timing the Measurement
IV curve tracing requires stable, sufficient irradiance — which in the MENA region means planning measurements around the clearest, most stable parts of the day and avoiding periods of variable cloud or low sun angle. Field scheduling is part of what makes IV curve tracing efficient at scale.
Soiling Interference
Because MENA soiling is so heavy, IV curve tracing results must be interpreted with soiling in mind — distinguishing a genuine fault from the uniform current suppression that heavy dust produces. This is exactly the kind of interpretation expertise that separates a competent IV curve tracing service from a raw data dump.
AQ Electric’s IV Curve Tracing Services
AQ Electric for Power Solutions, founded in Jordan in 2019 and expanded to Egypt in 2021, provides specialist IV curve tracing services across the MENA region as part of its complete solar PV testing and diagnostics offering. With over 1.0 GW of PV project experience and an ISO 9001, ISO 14001, and ISO 45001-certified management system, AQ Electric delivers IV curve tracing to full IEC 62446-1 Category 2 standard.
AQ Electric has applied IV curve tracing across a range of regional projects, including the Fountain Mall solar installation in Aqaba, Jordan (for Philadelphia Solar) and the King Hussein Park project in Amman (for Green Sources Investment), alongside utility-scale testing and commissioning work in Egypt and Saudi Arabia. This field experience — across commercial rooftops and utility-scale plants, in a range of climates and configurations — means our engineers bring genuine interpretation expertise, not just an instrument.
Our IV curve tracing services include calibrated environmental measurement, systematic string-by-string testing, STC normalisation, expected-value comparison, and a clear diagnostic report identifying every fault found and its likely cause. Whether you need commissioning-stage IV curve tracing to close out a project, or periodic operational IV curve tracing to protect long-term yield, AQ Electric’s engineering team has the equipment, the standards, and the regional expertise to deliver it. Explore our dedicated IV curve tracing services or contact our engineers to discuss your project.
AQ Electric Solar Testing & Diagnostics
The full testing scope, delivered across the MENA region.
📊IV Curve Tracing⚡Testing & Commissioning🔧Operation & Maintenance🔍Third-Party Inspection✓Quality Assurance (FAT & SAT)🚁Drone Inspection📐Engineering Services✉Speak to an Engineer
Frequently Asked Questions
What is IV curve tracing in solar PV?
IV curve tracing is a diagnostic test that captures the complete current-voltage curve of a solar string under real conditions and compares it against the expected curve. The shape of any deviation reveals the specific fault — shading, soiling, mismatch, resistance, or degradation.
Why is IV curve tracing better than monitoring data?
Monitoring data tells you a string is underperforming but not why. IV curve tracing reveals the specific cause by reading the complete electrical signature of the string — the difference between knowing there is a problem and knowing how to fix it.
Is IV curve tracing required by IEC 62446-1?
String I-V curve measurement is a Category 2 test under IEC 62446-1, recommended for all commercial and utility-scale systems and effectively required for bankable, lender-financed projects. See our IEC 62446-1 guide for detail.
How long does IV curve tracing take?
Each string measurement takes only a few minutes, though a full plant requires systematic testing of every string plus environmental measurement and analysis. AQ Electric plans IV curve tracing campaigns to complete efficiently within the commissioning or O&M schedule.
What faults can IV curve tracing detect?
Soiling, partial shading, module mismatch, series and shunt resistance faults, bypass diode failures, PID, degradation over time, and wiring or configuration errors — each with a characteristic curve signature.
Does AQ Electric provide IV curve tracing across the MENA region?
Yes. AQ Electric provides IV curve tracing services across Jordan, Egypt, Saudi Arabia, the UAE, and the wider MENA region, to IEC 62446-1 Category 2 standard, with over 1.0 GW of project experience.
See Exactly What Your Solar Array Is Doing
IV curve tracing is the definitive DC-side diagnostic — and AQ Electric delivers it to IEC 62446-1 Category 2 standard across the MENA region. From commissioning to periodic O&M, our ISO-certified engineers turn raw curves into clear, actionable answers. Over 1.0 GW of project experience, trusted by ACWA Power, NOMAC, SEPCO, CEEC, and Philadelphia Solar.
PV projects supported
MENA countries covered
ISO certifications9001 · 14001 · 45001
Founded in Jordan