In the dynamic world of solar energy, understanding the intricacies of simulation reports is crucial, and two metrics that often take center stage are P50 and P90. 📊
P50: The Reliable Median
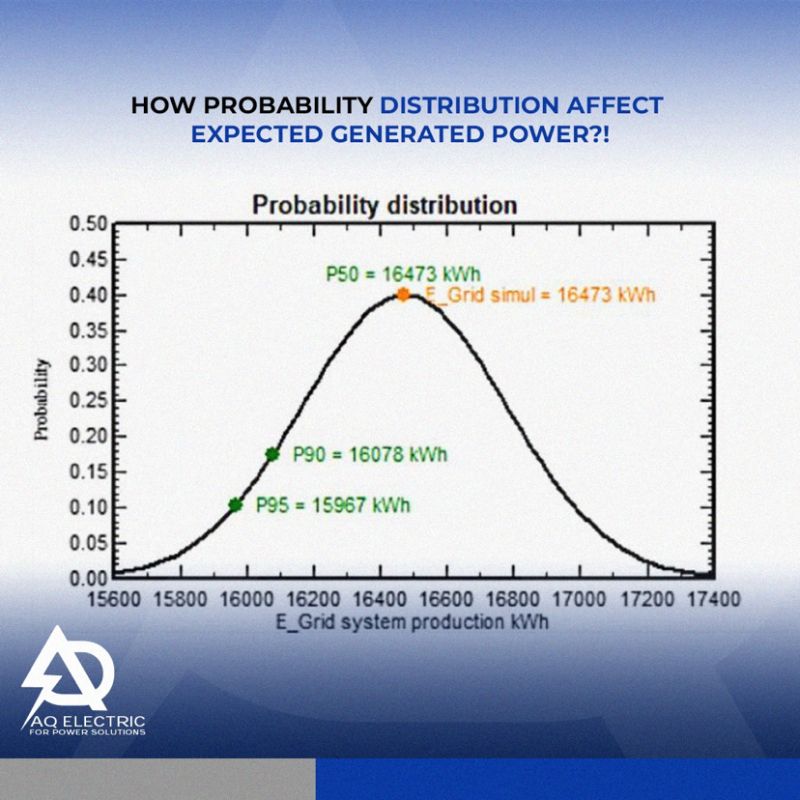
P50 represents the 50th percentile of expected energy production. In simpler terms, it’s the “most likely” scenario. When we talk about P50 in a PV system simulation report, we’re discussing the expected energy generation under normal conditions. It’s a solid benchmark for planning and investment decisions.
P90: Preparing for the Unexpected
On the other hand, P90 represents the 90th percentile of expected energy production. This metric accounts for variability and uncertainty, helping us prepare for less predictable scenarios. When we delve into P90 in a PV system simulation report, we’re acknowledging that while the sun is a reliable source of energy, it doesn’t always shine as brightly as we hope. P90 is a crucial metric for risk assessment and ensuring resilience in energy planning.
Balancing Act
Understanding both P50 and P90 is like walking a tightrope in the world of solar energy. P50 gives us a clear vision of what we can reasonably expect, while P90 reminds us to be prepared for less favorable conditions. Balancing these metrics is essential for making informed decisions, whether we’re designing PV systems, evaluating investments, or planning for energy resilience.
In the ever-evolving landscape of renewable energy, P50 and P90 are the tools that guide us toward a sustainable and reliable future. Let’s continue the conversation on how these metrics shape our PV system simulations and empower us to harness the full potential of solar energy.
For more information and requests you can reach us,,
– Email: Aqatawneh@aqelectric.net
– Mobile: +201151006630
+962795154126